
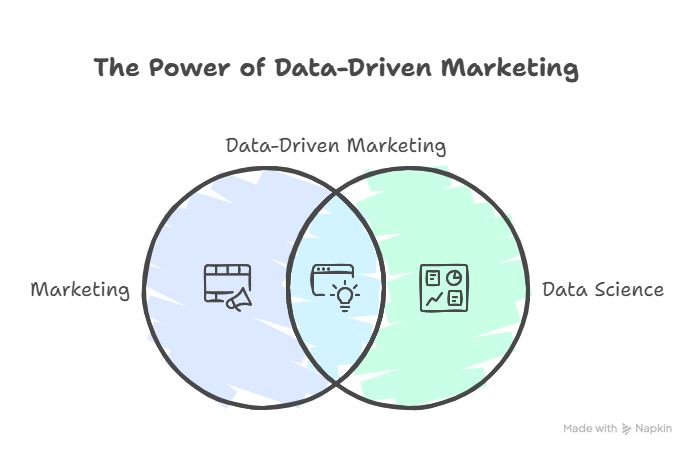
Marketing and data science together form a powerful alliance: data science provides the methods and tools for extracting actionable insights from vast customer-behavior datasets, while marketing applies those insights to craft targeted campaigns that drive measurable outcomes.
Where once gut instinct and broad demographics ruled, today’s marketers leverage predictive models and real-time analytics to personalize user experiences and optimize spend.
As brands compete for attention in crowded digital channels, mastery of analytics isn’t merely an advantage—it’s essential for delivering higher ROI and staying ahead of emerging trends.
Self-assessment: Where are you on the data fluency spectrum?
Before embarking on your learning journey, assess whether you’re a Novice, Intermediate, or Advanced data user. The Data Literacy Project offers a free self-assessment to benchmark your comfort with data interpretation, manipulation, and decision-making.
Funnel.io recommends a six-step path to data literacy—starting with mandating basic data skills across your team, then focusing on data hygiene, actionable metrics, self-service analytics, visualization mastery, and continuous upskilling.
Action: Complete a data-fluency quiz, then map your results against the competencies outlined in this roadmap to identify immediate learning priorities.
Stage 1: Building your marketing analytics foundation
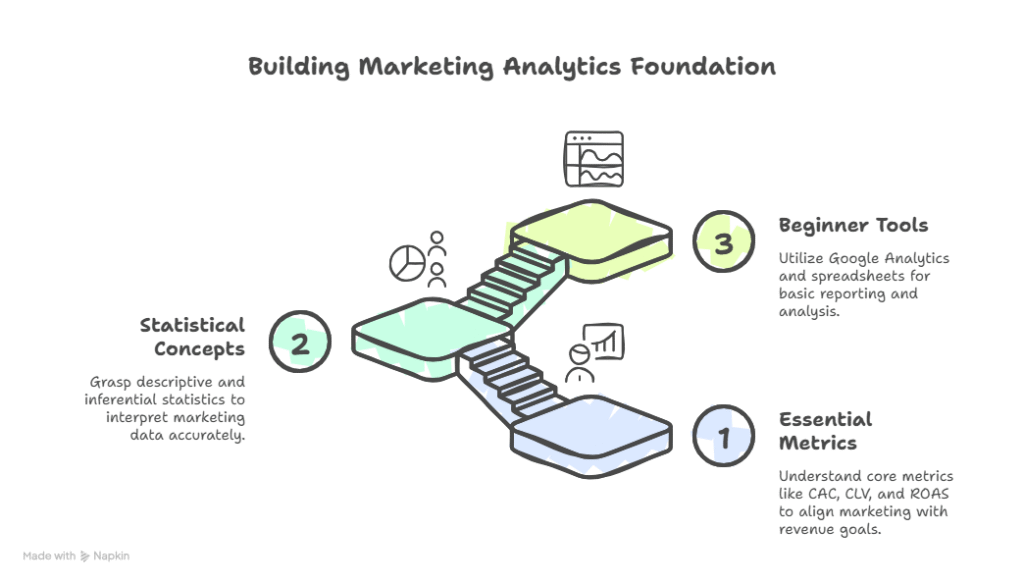
Essential metrics every marketer should understand
- Customer Acquisition Cost (CAC) and Customer Lifetime Value (CLV) as the core profitability duo.
- Conversion Rate, Click-Through Rate (CTR), and Bounce Rate for tracking funnel performance.
- Return on Ad Spend (ROAS) and Marketing-Originated and Marketing-Influenced Pipeline for aligning marketing activity with revenue goals.
Understanding these metrics ensures you can interpret dashboards critically and speak the language of revenue-driving stakeholders.
Basic statistical concepts that drive marketing insights
- Descriptive Statistics (mean, median, mode, variance) to summarize campaign performance.
- Inferential Statistics (confidence intervals, hypothesis testing) for determining if observed differences are statistically significant.
- Regression Analysis to quantify relationships (e.g., how budget lift impacts conversions).
- Cluster Analysis and Segment Detection for exploratory segmentation efforts.
A solid grasp of these principles prevents common pitfalls like misinterpreting random fluctuations as meaningful trends.
Tools for beginners (Google Analytics, spreadsheets)
- Google Analytics for basic traffic, acquisition, and behavior reporting; its familiar UI makes it an ideal first analytics platform.
- Microsoft Excel & Google Sheets for quick pivot-tables, basic visualizations, and ad-hoc analysis; built-in functions (VLOOKUP, pivot tables, charts) empower non-technical users.
- Free Data Visualization Add-Ons like Google’s Data Studio or Sheets’ built-in charts for creating shareable, interactive dashboards.
Next Steps: Complete Google’s free Analytics Academy courses and build sample dashboards in Sheets to solidify foundational skills.
Stage 2: Advancing your analytical capabilities
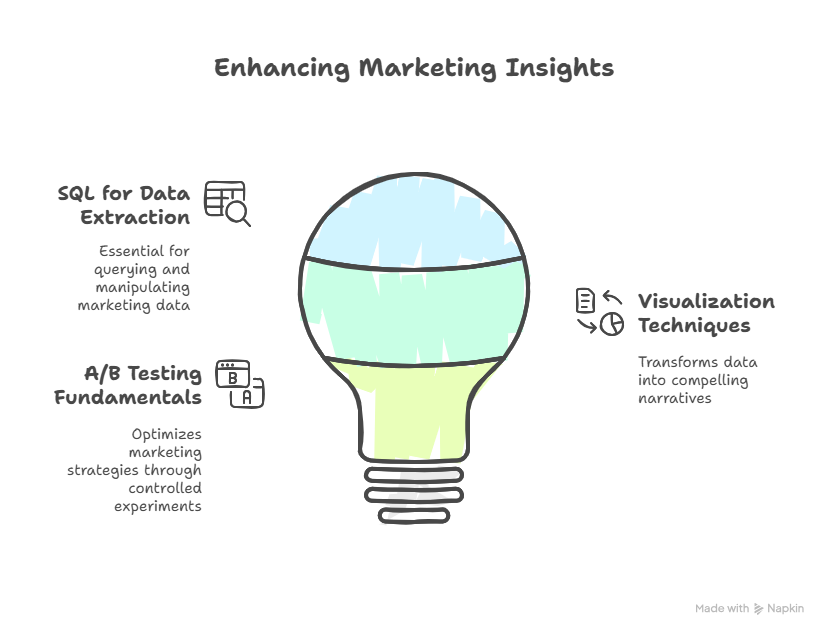
Introduction to SQL for marketing data
Structured Query Language (SQL) is essential for extracting, filtering, and joining datasets stored in customer and analytics databases.
Key concepts: writing SELECT, WHERE, GROUP BY, and JOIN statements to answer business questions (e.g., “Which campaigns drove the most high-value users?”).
Online courses such as Seer Interactive’s “Beginner SQL for Digital Marketers” or Udemy’s “SQL for Marketers” offer hands-on exercises using marketing datasets.
Action: Launch a sandbox database (e.g., BigQuery sandbox) and practice queries on real or simulated marketing tables.
Visualization techniques that tell compelling stories
Effective visualizations transform numbers into narratives. Use bar and line charts for trend analysis, scatter plots for relationship discovery, and heat maps for geospatial or time-based insights.
Improvado’s guide emphasizes choosing the right chart for your story, focusing on clarity (no unnecessary decoration), and highlighting callouts to draw attention to key findings.
Tip: Always start with the question you want to answer, then select the visualization that most directly illustrates the answer.
A/B testing fundamentals and common pitfalls
A/B testing enables evidence-based optimization by comparing a control versus a treatment under controlled conditions.
Pitfalls include: insufficient sample size (underpowered tests), peeking at results (inflated Type I error), and ignoring statistical significance versus practical significance.
Harvard Business Review outlines further traps: neglecting segment differences, failure to run parallel tests, and drawing conclusions without considering external factors.
Exercise: Design, execute, and analyze a simple landing-page test using Google Optimize or Optimizely to apply these learnings.
Stage 3: Implementing predictive approaches
Customer segmentation techniques
Segmentation moves beyond demographics to include behavioral, value, and psychographic dimensions.
Use clustering algorithms (K-means, hierarchical clustering) to discover natural groupings based on engagement, spend, and content preferences.
Outcome: Tailored messaging and offers for high-value segments, improving both acquisition efficiency and retention rates.
Predictive modeling for marketing outcomes
Predictive models forecast metrics like churn risk, propensity to convert, or expected lifetime value by training on historical features such as session data, past purchases, and engagement signals.
Regression, decision trees, and ensemble methods (random forests, gradient boosting) are common starting points.
Implementation: Use Python libraries (scikit-learn) or automated platforms (DataRobot, H2O.ai) to prototype models and evaluate using AUC, precision-recall, and calibration plots.
Machine learning use cases in marketing
Beyond prediction, ML powers recommendation engines, dynamic creative optimization, and churn-prevention systems.
Real-world examples: Netflix-style content recommendations in email campaigns, AI-driven bid strategies in programmatic ad buys, and generative models for ad creative iteration.
Tip: Start with a focused pilot on high-impact use cases, ensuring you have clean data and a clear success metric before scaling.
Stage 4: Becoming a marketing data scientist
Building automated reporting systems
Automate routine dashboards and reports to free up time for strategic analysis. Tools like Looker, Tableau, or Power BI connect directly to data warehouses and refresh on schedule.
Implement ETL processes (Airflow, dbt) to standardize and transform data pipelines, ensuring consistency across reports.
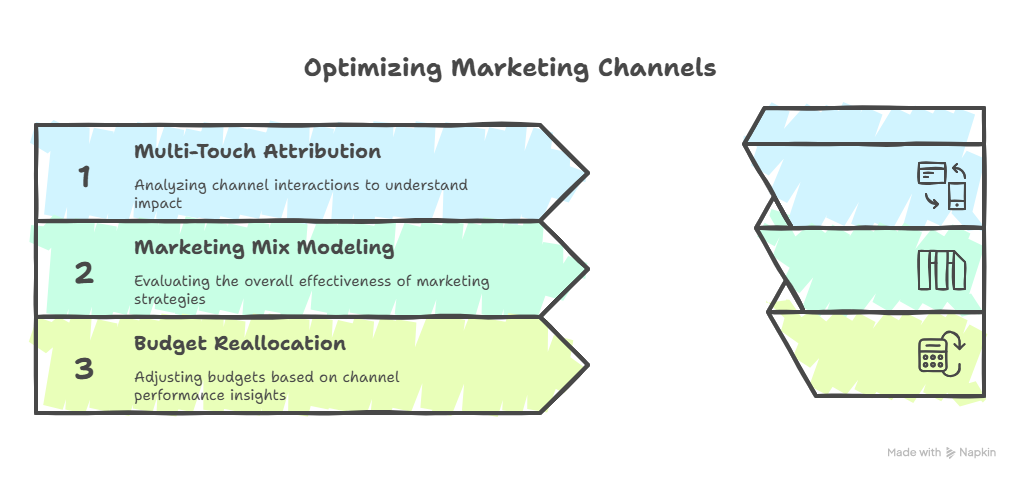
Cross-channel attribution modeling
Move beyond last-click attribution by using multi-touch attribution (Markov chains, Shapley values) and marketing mix modeling to quantify each channel’s incremental impact.
This holistic view informs budget reallocation, uncovering under-leveraged channels or over-credited touchpoints.
Leading data-driven decision making
Champion a culture where hypotheses are tested rigorously and decisions are backed by data. Harvard Business School finds that organizations committed to data-driven decision-making see three times better outcomes than intuition-based peers.
As a marketing data scientist, your role expands to mentoring stakeholders in interpreting analyses, establishing governance for data quality, and aligning analytics roadmaps with business objectives.
Conclusion: Action plan and resource recommendations
Action Plan:
- Complete a data-fluency self-assessment and identify gaps.
- Master foundational metrics and statistics, building sample dashboards.
- Learn SQL and visualization via hands-on projects.
- Run real A/B tests and iterate on test design.
- Pilot segmentation and predictive models on your data.
- Automate reporting, adopt advanced attribution, and evangelize data-driven practices.
Top Resources:
- Books: Marketing Analytics Roadmap by Jerry Rackley for end-to-end guidance.
- Courses: Google Analytics Academy, Udemy’s “SQL for Marketers”, Coursera’s “Data Science for Business” specialization.
- Communities: Data Literacy Project, Kaggle (marketing datasets), and LinkedIn groups on Marketing Analytics.
By following this structured roadmap, you’ll accelerate your journey from marketing novice to data-driven decision-maker, equipped to leverage the full power of data science in optimizing campaigns and driving business growth.